-
About Us
Retailers
Transactions
-
Be a part of our next development.

-
Second Generation Spaces
See move-in ready opportunities.

Environmental Stewardship
Long-term sustainability is in the best interest of our stakeholders and the environment.
2025 Highlights
Sustainability — Our Commitment
We strive to integrate sustainable practices throughout our business. We also take steps to address material environmental risks and issues across our operations and development projects.

Committed to Environmental Impact
Our approach integrates environmental stewardship to advance sustainability and resilience across our assets and is deeply embedded in our business strategy, decision-making, and operations.

Reducing Our Carbon Footprint
In 2021, we established a science-based target to reduce absolute Scope 1 and 2 GHG emissions by 28% by 2030. Through focused execution, we have exceeded our 2030 target five years ahead of schedule.

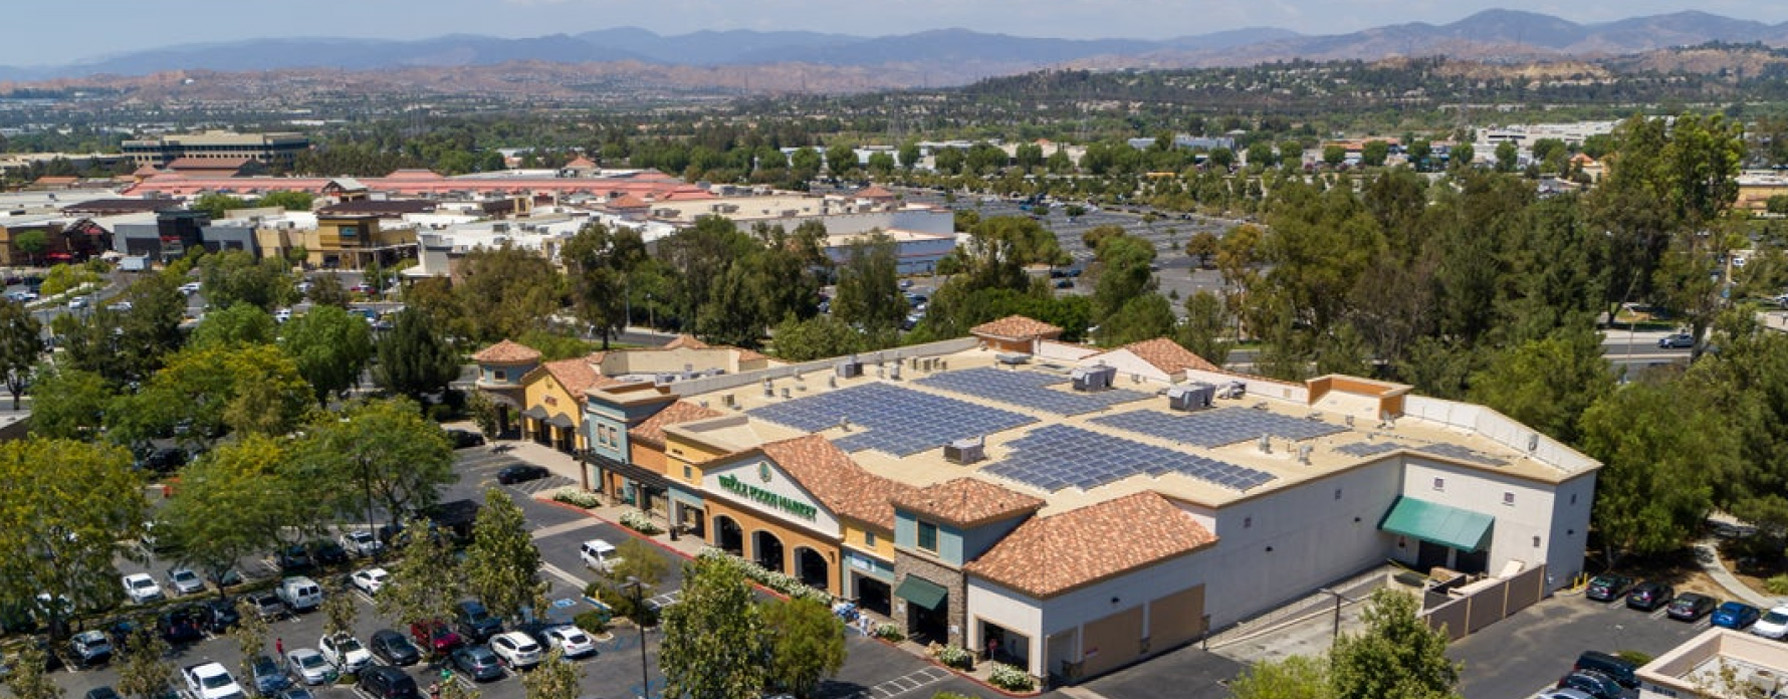
Advancing Renewable Energy
Regency continues to expand the use of renewable energy technologies across our shopping centers, delivering more affordable, cleaner power to our tenants and the communities we serve.
Reducing Our Impact
At Regency, being good stewards of our investors’ capital and the environment in which we operate is one of our core values. We are committed to delivering long-term value for our shareholders while thoughtfully considering the needs of our broader stakeholders.
Reducing Our Energy Use
Improving energy efficiency across our operational control is critical to achieving our GHG and energy targets.
Driving Impact Through Water Efficiency
We're committed to conserving this vital resource to protect the environment, reduce drought impacts, and preserve it for future generations.
Diverting Waste, Driving Sustainability
In partnership with our tenants and networks of local recyclers, composters, and waste haulers, we work to promote responsible waste management practices across our shopping center portfolio.
Green Building
We have developed 16 LEED-certified assets totaling 1.8 million square feet. Our Green Building Task Force ensures that our construction projects align with our sustainability goals and industry best practices.

EV Charging
Regency has been a leader in supporting the development of a national network of electric vehicle (EV) charging stations. We now have a total of 1,654 active stations spread across 35% of our properties.

Recognition and Partnerships

Named Green Lease Leader Platinum Level by the Institute for Market Transformation and the U.S. Department of Energy
Developer of 16 LEED Certified Assets